Bitcoin Price Analysis: Bitcoin Price has reached again to level of $55,000 / coin, which under consideration of September analysis.
Let’s take a look on the Point and Figure Chart to see the current situation of Bicoin Price.
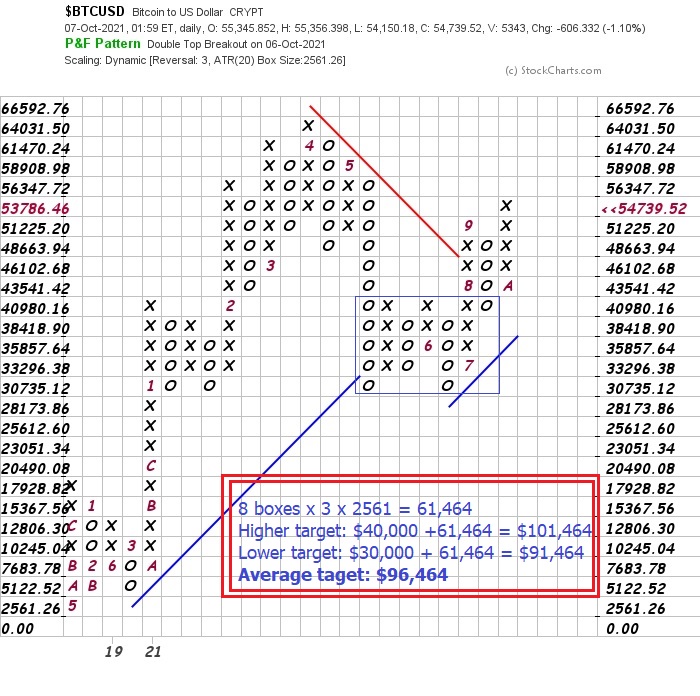
Above is Point and Figure chart off Bitcoin Price which apply 3 boxs reversal and box size around $2500.
First view on the chart we see the down trend from Distribution phase in Mar was broken and price make a Trading Range between level of 30,000 – 40,000 from May to end of July
In August, we have price broken the higher range of that TR and reach to level of $55,000
In the end of Sep, 2021 price retrace to level of $41,000 we expecting the Back Up action according to Wyckoff Method of trading and the volume occurd in the market.
The $55,000 would be the confirmation to uptrend continuation if price break range $55,000 – $59,000
Then we can have calculation for the final target around $90,000 ~ $100,000. I just consider the average target around ~$96,000 / Coin for long term point of view
Bitcoin Price Analysis Oct, 2021
Take a look on the Bictoin Price sharp chart above we can see the backup Action of price in during the end of Septemeber 2021 with the effort to push price down but not make any results by the buyer willing to come back and defense Seller at the level $40,000.
The Buyer started their duty around $41,000 and push price up, from this time we can see the buying volume much greater than selling volume.
For above analysis, we strongly expect Bitcoin Price may go up to the expected target in long term point of view.